The average overlap between US CLO managers’ portfolios has increased since our last report in 2024. This report dissects portfolio overlap, as per the latest US CLO trustee reports, between managers for deals closed in 2023 and 2024 (see the bottom of this article for methodology).
At the time of this analysis, CLO and loan markets have been on divergent paths: new loan issuance is down, while CLO issuance has sky-rocketed. This shift means that CLOs make up a larger share of the loan market.
“The share of the loan market that is in CLOs has increased from 50% to 70% as the public broadly syndicated loan market has grown from $1.4trn to $1.5trn over the last four years,” says Kashyap Arora, co-chief investment officer at Vibrant Capital Partners. This is during a time period the US BSL CLO market has grown much more rapidly, and stands at $980bn as of the end of Q3, according to 9fin data.
US CLO manager overlap has increased 2.9 percentage points from 38.8% in 2024 to 41.7% in 2025. This is still considerably lower than in Europe, where our latest analysis found average overlap of 53.68%.
Although overlap has increased this does not mean that diversity is lacking. “Yes, there has been an increase in the overlap of issuers amongst CLO portfolios, but there has also been an increase in diversity scores across the market,” Arora explains.
“A few years ago, diversity scores were in the 60s and 70s, and now they are typically in the 80s. So while one might expect homogeneity of performance as a result of portfolio overlap, we’ve actually seen increased dispersion in manager performance.”
Of the CLOs within our dataset the average diversity score was around 86, according to 9fin data.
Arora added: “Managers have recognized that concentration in a single name is a real risk in CLOs. Managers therefore seek to construct a more diverse portfolio and they let the structure do the work.”
One CLO investor said, “portfolio overlap is not a top five risk in CLOs”.
Although investors are not seeing this overlap as a major risk, it does represent an underlying shift in the structure of leveraged loans, with another investor adding “investment in the loan market has shifted away from retail and daily liquidity to more stable long term quasi-permanent capital.”
Market leaders surpass 50% in market average overlap
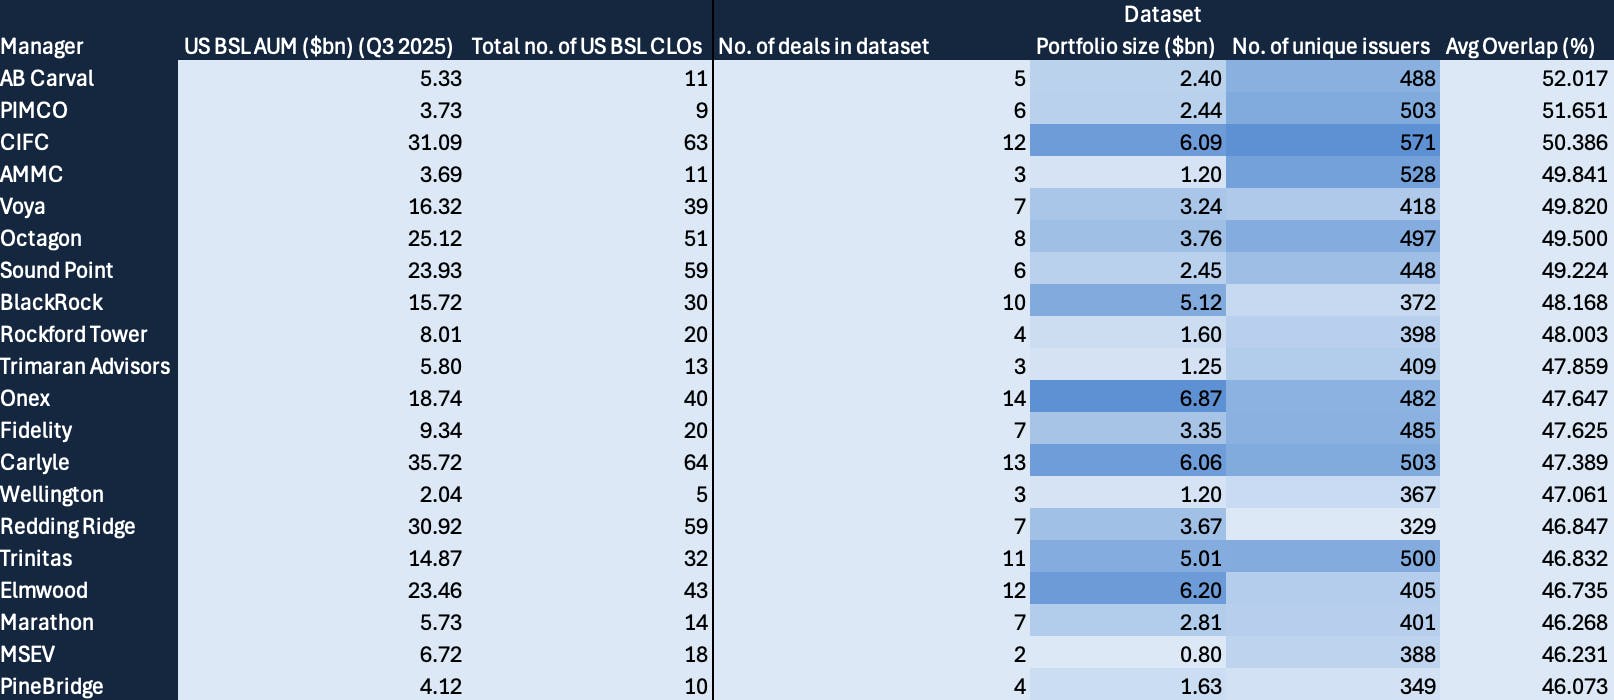
In 2024 Voya Alternative Asset Management held the market’s largest average overlap at 49.9%. Now, in 2025, AB Carval has the largest average overlap with the market at 52%. AB Carval has five deals in the data set, totalling $2.4bn with 488 unique debt issuers. It’s largest exposure is to Pro Mach at $30.1bn.
Pimco has the second largest market average overlap with 51.7% and has six deals in the data set, for a total of $2.4bn with 503 unique debt issuers. CIFC was third highest with 50.4% followed by American Money Management and then Voya.
Notably, the top three managers with the largest market average overlap all exceed 50% — a shift from last year’s analysis, where no managers had an average market overlap above 50%.
AB Carval’s largest overlap with a manager was 70% with CIFC Asset Management. The Ineos Group is the highest common issuer between AB Carval and CIFC at $64.5m. AB Carval’s other kindred spirit was Voya with 69.7% overlap between the pair.
But the largest overlap between any two managers was BlackRock and Pimco at 72.4%. These fixed income giants are similar in many ways and that commonality extends into CLO management. TransDigm Group is the issuer they have most in common at $80.9m combined. This represents Pimco’s largest CLO exposure as it holds $19.4m of TransDigm Group, while BlackRock holds $61.5m
Pimco also had a 71.6% overlap with CIFC.
Some of the managers that have closed M&A transactions this year (and thus have been kept apart for the purposes of this dataset) are already growing more similar. Redding Ridge and Irradiant (the former’s acquisition of the latter was announced in February) share a 64% overlap, compared to last year when they had 48% overlap.
Perhaps fittingly given the deliberate separation of the platforms, HPS and BlackRock actually show less overlap in this year’s dataset — 53% compared to 59% last year.
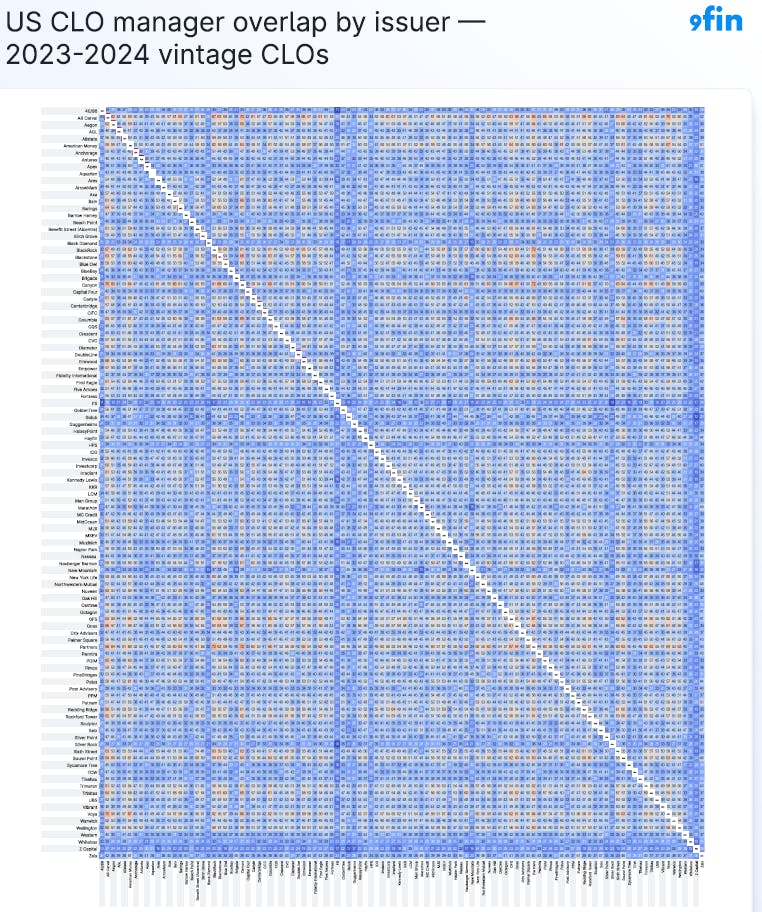
To view a full graphic highlighting manager overlap among US CLO issuers click here.
Z Capital with lowest market average overlap
If unique CLO portfolios is what you’re after then Z Capital is the place to go with the firm holding the lowest market average overlap of 24%. Z Capital’s lowest overlap with another manager was 12.3% with Golub Capital. Z Capital is one of 17 managers to have only one deal in this data set. Even with great differences, there tends to be at least one credit that two CLO managers will share and so it is with Z Capital and Golub having Great Outdoors Group in common at $2.5m.
Z Capital’s portfolio has the largest exposure to Oldcastle BuildingEnvelope with $5m and the least exposure in its portfolio is with Sirva at $228,042.
Fortress Investment Group is just above Z Capital, second to lowest in market average overlap with 24.4%. Standing out is not uncommon for Fortress — last year it was the manager with the lowest average overlap in our dataset. Contrary to Z Capital with one deal, Fortress holds this position with eight different deals in the data set and a portfolio size of $3.3bn.
The lowest overlap between any two managers is Fortress and Silver Rock Financial with 10% overlap. Fortress has low overlap with multiple other managers: 11% with 40/86 Advisors, 15.1% with Muzinich, 16.1% with Sycamore Tree Capital Partners, and 16.1% with KKR.
TransDigm takeover
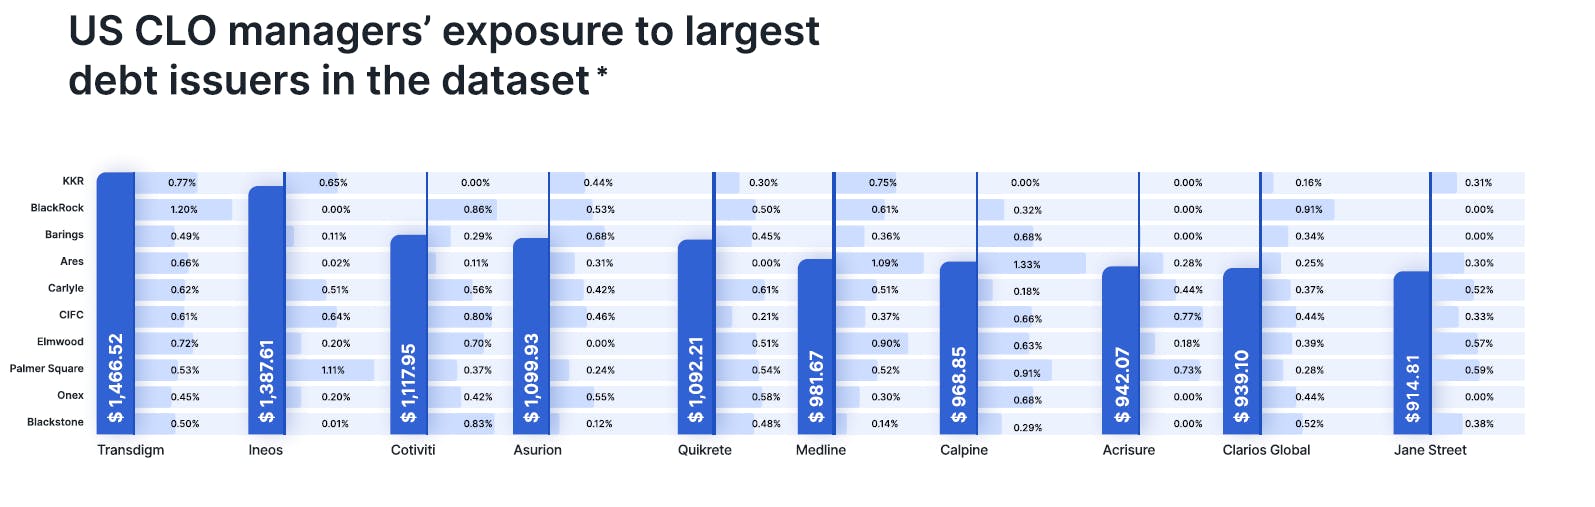
The largest debt issuer held amongst US CLOs closing in 2023 and 2024 was TransDigm with $1.5bn. BlackRock has the largest exposure with $61.5m out of its $5.1bn portfolio for 1.20%.
Ineos is the second most held issuer with $1.4bn, however, BlackRock does not hold any of Ineos. The largest debt holder of Ineos is Palmer Square Capital Management with $75.9m and 1.11% of its portfolio.
The manager with the largest exposure to one specific issuer is Ares Management. It has a portfolio size of $5.1bn with $69m in Calpine making up 1.33% of Ares’ portfolio.
Methodology — dataset consists of
- US BSL CLOs
- Excludes deals with high triple-C buckets, CBOs
- CLOs with a closing date in 2023 or 2024
- CLOs still outstanding as of November 2025
Overlap is calculated on the basis of matching issuers (rather than individual issues) that appear within both manager’s portfolios as a % of combined portfolio. Data is taken from the latest available trustee reports as of November 2025. Managers that have acquired CLOs from other managers have been combined in the dataset. This includes Sound Point & BlueMountain, HPS and Park Avenue, Franklin Advisors and Putnam and Investcorp and Marble Point. This does not include transactions that closed in 2025 or where platforms are operating separately, including HPS and BlackRock, Bardin Hill and Man Group and Irradiant & Redding Ridge.