Don’t miss out on news you won’t find anywhere else — get The Memo US and The Memo Europe in your inbox every two weeks.
The European CLO market has been growing but portfolios are looking more alike, according to 9fin analysis. Last year when we ran this analysis, the average manager overlap was 51.8%, and this has now increased to 53.68%. For this report, we look at the portfolio overlap, as per the latest European CLO trustee reports, between CLO managers for deals that closed in 2023 and 2024 (see the bottom of this article for methodology).
The increase in overlap is not entirely surprising due to the somewhat limited supply this year. As one investor stated “there has not been a lot of supply but the loan market has actually grown maybe 7-8%”. This is also balanced against the demand from new managers entering the market and a high proportion of existing managers printing new issues this year.
The size and concentration of the European market naturally contributes to this increase in overlap. One European investor stated, “because Europe is so concentrated and the loan market is so small, overlap is generally around 45%-50% give or take 5%”. This analysis showed 46 out of the 59 European managers have an average of manger overlap greater than 50%.
"CLO managers start off with a very large overlap of portfolios on day one — that’s just how Europe works. So if you want to stand out, you have to differentiate through trading," says Rajat Mittal, partner and head of leveraged credit at Signal Capital.
Each manager has different ways to differentiate. Signal, which priced its inaugural deal in May 2023, has been working to maintain a unique portfolio. “We’re in the top 10% for actively trading CLO managers according to several bank research pieces — we generally make a trade a day, which is significantly more than the market. That means by day two, our portfolio already looks different. Those small, early moves compound into real outperformance."
Mittal highlights that Signal has been placing 90% of its equity to external investors from as early as deal three, which underscores investor confidence in the firm's strategy. “Being a close-knit fund shop also helps. We sit close enough to discuss with different teams in seconds. That communication means we can react faster, build conviction quicker, and move before the rest of the market even starts discussing it,” Rajat explained. According to our analysis, Signal has an average manager overlap of 50.4% with the market.
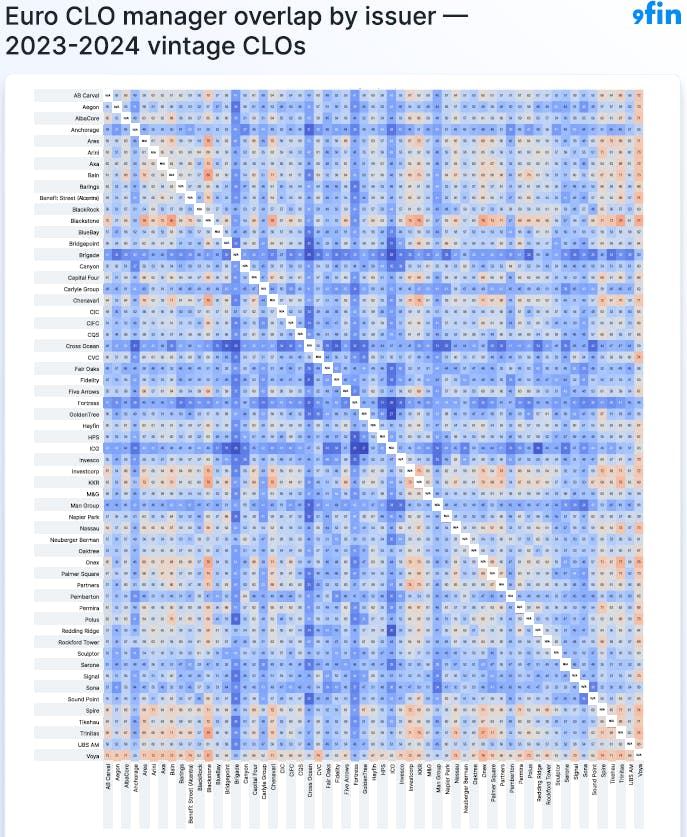
High overlap — Voya remains at the top
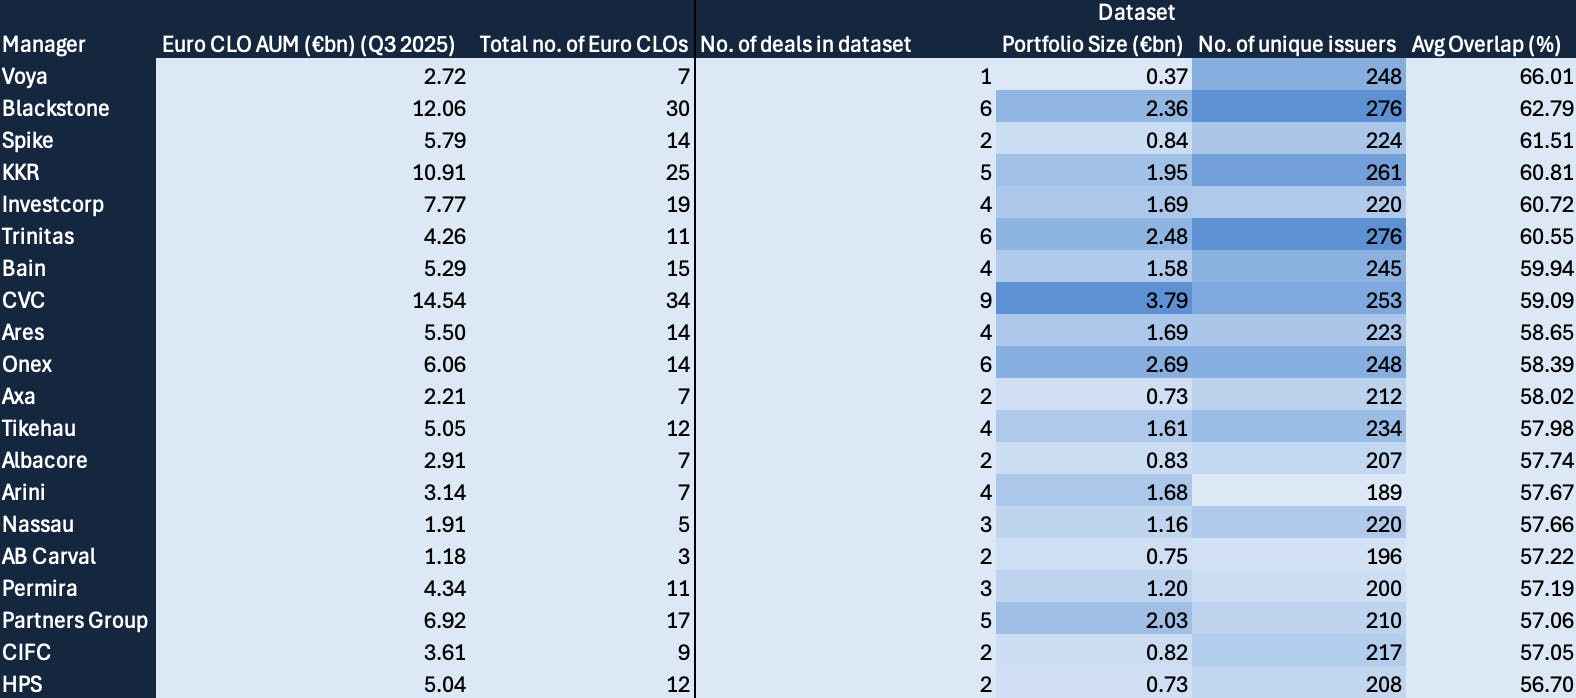
In 2024 Voya Alternative Asset Management was the manager with the largest overlap in the European CLO market with 62.5% on average. In 2025, Voya remains the manager with the highest average manager overlap with 66%.
Voya only has one deal in the data set worth €0.37bn with 248 unique issuers. Voya’s largest exposure is €8.7m to the newly consolidated ION Platform, more specifically the arm previously known as ION Trading Technologies and €5.7m to Ineos.
Voya’s largest overlap is 77.3% with Blackstone Credit which is the second highest in average manager overlap at 62.8% (although Blackstone is a completely different profile to Voya as it is among the largest European CLO issuers). ION Group is the issuer with the largest overlap between Voya and Blackstone.
Blackstone has six deals in the data set totaling €2.4bn with 276 unique issuers. The largest overlap between any two managers is Blackstone and Bain Capital with 80.2%. A European CLO investor said “it is typical for two of the largest CLO managers to have high overlap because they buy everything together, and they are good at what they do”.
Blackstone also has high overlap with other managers, including: 79.2% with Trinitas Capital Management, 78.6% with KKR, 78.4% with Onex and 77.8% with CVC Credit Partners.
Blackstone’s largest exposure is €35.1m in Gerflor (aka Hestia) and its second largest exposure is to ION with €33.8m.
To view a full graphic highlighting manager overlap among European CLO issuers click here.
Lowest overlap — Brigade stands alone below 40%
There is only one European manager with an average manager overlap under 40%, Brigade Capital Management. It has 39.5% average manager overlap and one deal in the data set.
Brigade has its largest overlap of 50.4% with Redding Ridge Asset Management. ES Global Finance is the issuer they hold most in common at €47.3m.
Brigade’s lowest overlap is 28.4% with Intermediate Capital Group (ICG) and then 28.6% with Chenavari Credit Partners.
Chenavari and Fortress Investment Group are just ahead of Brigade in average manager overlap rankings (each has one deal in the data set as well as Brigade). Chenavari has a 40.8% average manager overlap and Fortress has 40.9%. Fortress, which has only recently made its debut in Europe, is long-established in the US and known for having low levels of overlap with the market.
The absolute lowest overlap between managers is between ICG and GoldenTree Asset Management with 26.7%. Other low overlaps occur between Fortress and ICG with 27.8%, Chenavari and Brigade who have an overlap of 28.6%, and ICG and Redding Ridge at 29.72%.
Ineos is everywhere
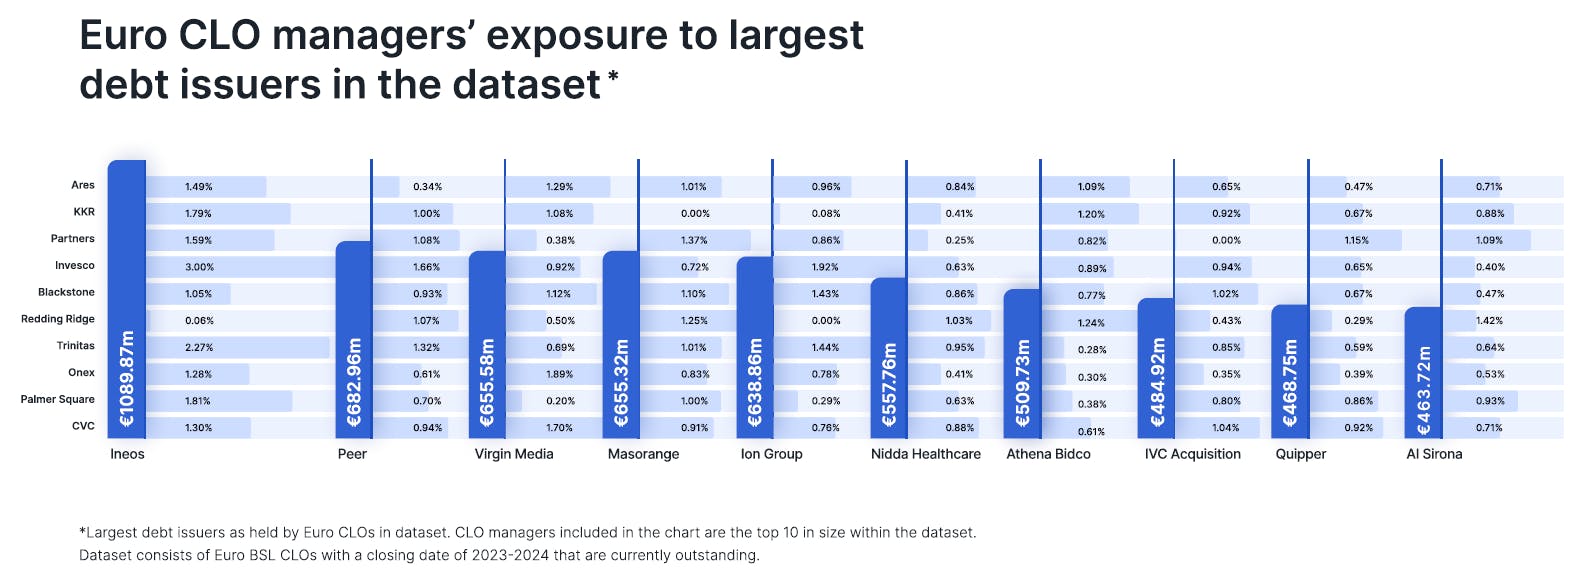
Similar to our 2024 overlap analysis, Ineos Group is the largest debt issuer held by European CLOs with €1.1bn. Ineos has faced some troubles in the market with headwinds affecting chemical companies across Europe. 9fin recently reported on Ineos Quattro’s Q3 earnings call where it outlined steps to address 2027 maturities. Invesco has the largest exposure to Ineos, holding €62.5m, which accounts for 3% of its €2.1bn portfolio.
CVC Credit Partners, the largest manager in Europe by total AUM, manages the largest portfolio in our dataset with €3.8bn. The largest single issuer in its CLOs is Virgin Media at €64.6m, which represents 1.7% of the total portfolio.
The second largest debt issuer among European CLOs is Action Retail (Peer) with €683m held in European CLOs. CVC has €33.5m invested into Peer, accounting for 0.94% of its total portfolio.
Amid the interest from US CLO managers looking to establish European platforms, there are key differences between the two markets.
One European investor explained that because “the European market is so small compared to the US CLO market that when one thing goes wrong half the market gets hit, whereas in the US if one thing goes wrong only one sector is affected”.
TwentyFour Asset Management said, “for that reason, our analysis of the two markets is different — in the US we focus on industry exposures and in Europe we focus more on overlap and concentration risk in single names.”
Methodology — dataset consists of
- European BSL CLOs
- CLOs with a closing date in 2023 or 2024
- CLOs still outstanding as of November 2025
Overlap is calculated on the basis of matching issuers (rather than individual issues) that appear within both manager’s portfolios as a % of a combined portfolio. Data is taken from the latest available trustee reports as of November 2025. Managers that have acquired CLOs from other managers have been combined in the dataset. This includes Sound Point & BlueMountain, and MV Credit & Trinitas. This does not include BlackRock & HPS, or Bardin Hill & Man Group as these transactions were closed after 2024 and/or the platforms are being managed separately.